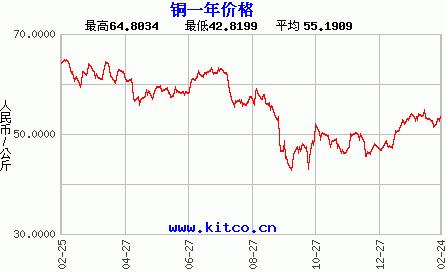
 One year copper price chart (New York spot)
 (Unit: RMB/kg is updated once a day)
Delivery from Malaysia Warehouse
Guangzhou Fengjiu New Energy Technology Co.,Ltd , https://www.flashfishbattery.com
One year copper price chart (New York spot) Delivery from Malaysia Warehouse
Guangzhou Fengjiu New Energy Technology Co.,Ltd , https://www.flashfishbattery.com